1. Overview
In this project, our team will try on building web-enabled visual analytics application by using R Shiny. The project aims to democratize data and analytics. The application will focus and emphasize on interactivity and effective integration of techniques from data analytics and data visualization.
2. Project Topic
The topic of Visual Analytics Project will be based on VAST Challenge 2022. Our team will choose Challenge 1 and build a Shiny Application to answer the questions of the Challenge. Challenge 1 is to understand the city’s demographics and relationships. We will analyse the available data about the social networks and other information of the city to learn about the city’s demographics, its neighborhoods, and its business base.
3. Motivation
The purpose of the project is to help the city planning team of Engagement, Ohio USA to understand the current state of the city and identify opportunities for future growth. The visual analytics exercise can use related visual analytic techniques to analyse the data collected from the representative residents using the city’s urban planning app.
4. Problems and Issues
In this project, we will solve three main problems of Challenge 1. First, assuming the volunteers are representative of the city’s population, we will characterize the demographics of the town. Also, considering the social activities in the community, we will describe the patterns in the social networks in the town. Lastly, we will identify the predominant business base of the town, and describe patterns we observe.
5. Related Work and Approach
5.1 Demographics
Population can be visualized through a variety of charts such as pie charts, maps, line charts, bar charts and etc, which are all helpful to visualize population.
For age, we can use a stacked bar plot(Global age-sex-specific fertility, mortality, healthy life expectancy (HALE), and population estimates in 204 countries and territories, 1950–2019: a comprehensive demographic analysis for the Global Burden of Disease Study 2019), pie or donut chart to reveal how people’s ages are distributed in a single population group.
For education level, there is a study about Mapping disparities in education across low- and middle-income countries published on Nature in 2019. They studied the relationship of the change in average educational attainment rate and income. They use terminal mapping to visualize it.
5.2 Social activities
For the social analysis, we can use the following library packages to visualize people ’s social activities and patterns:
- visNetwork
- geomnet
- igraph
References:
5.3 Predominant business base
For this analysis, we will try visualizing the no. of check-ins or travels of different locations and venue types by interactive line charts. We will also try revealing and describing spatial patterns and relationships on maps using the following R packages:
- sf
- tmap
- raster
- stars
- micromap
- geofacet
For the location data in the dataset, we can learn how to use polygon and apply to visualize the location of the business bases.
5.4 Data journalists and other dataviz professionals
- Alberto Cairo - University of Miami, Data Visualization Studio and weblog on visualization, infographics and data journalism
- David Candless (Information is Beautiful)
- Guardian datablog
- John Grimade, Ohio University, School of Visual Communication.
- Hans Rosling TED talks
- Moritz Stefaner - freelance information visualiser
- Edward Tufte (books - The Visual Display of Quantitative Information)
- Nathan Yau - flowing data
- Stamen Design
- Naomi Robbins - Forbes
6. Storyboards and Prototypes
Below are some initial prototypes/graphs that our group generated
using Tableau and R. Functions will be built on Shiny application for
users to interactively generate similar graphs.
6.1 Demograhics
For the discrete values such as age, we can use line plot and use color to denote the number.
For age group and have kids, we can use pyramid plot.
 For interest group, we use

For the relationship of education level and kids, we can use stacked histgram.

For joviality, we can use violin plot.


The demographics can focus on the interactivity and provide more flexible choices of inputs variables in the Shiny application to give users better experience when visualizing demographics of the city.
6.2 Social activities
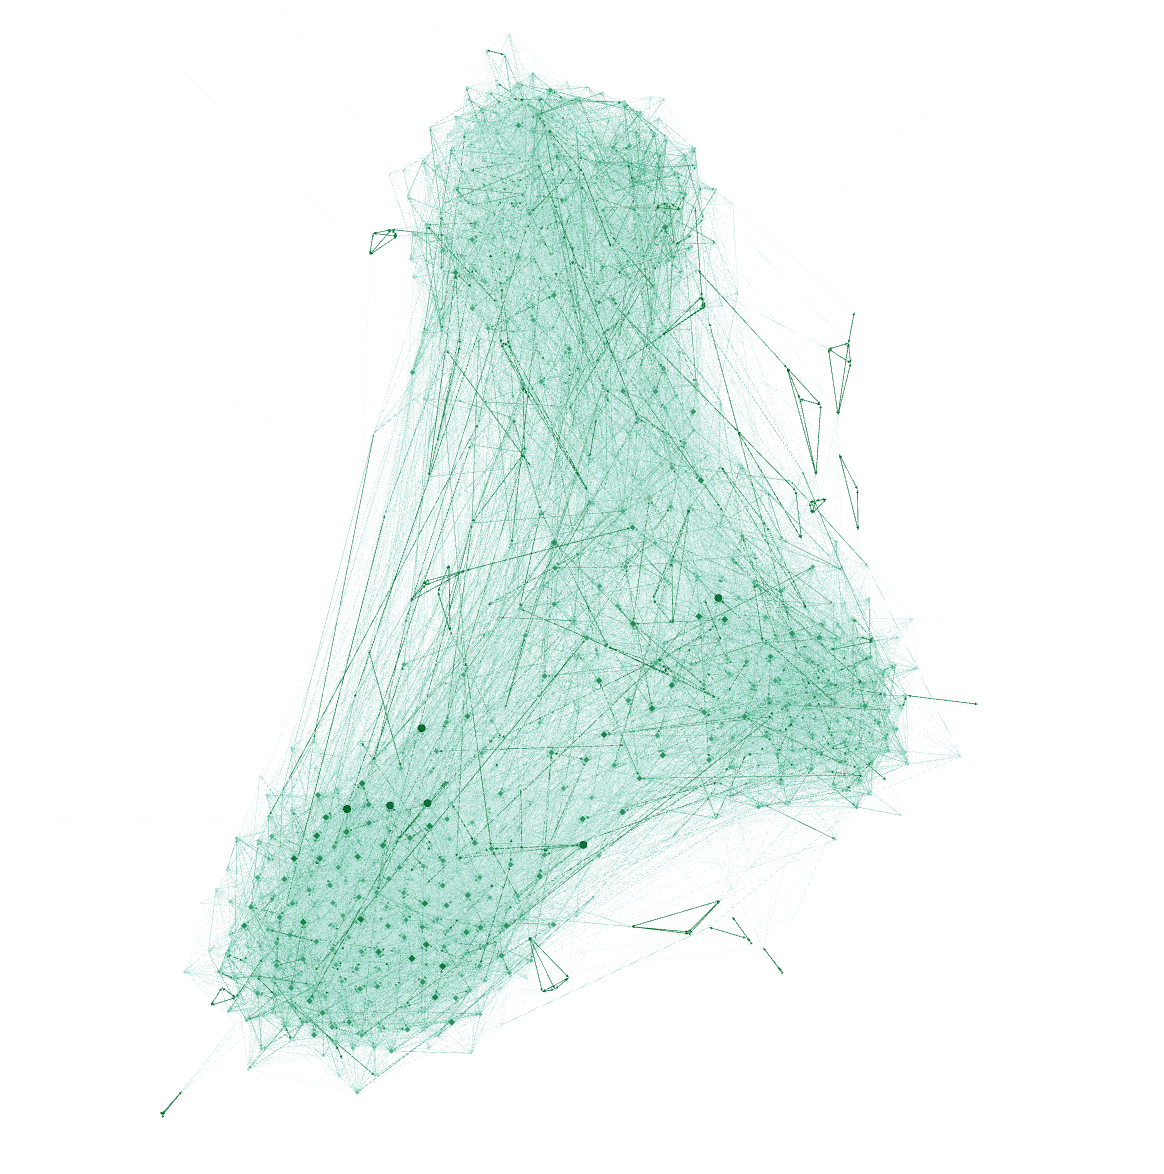
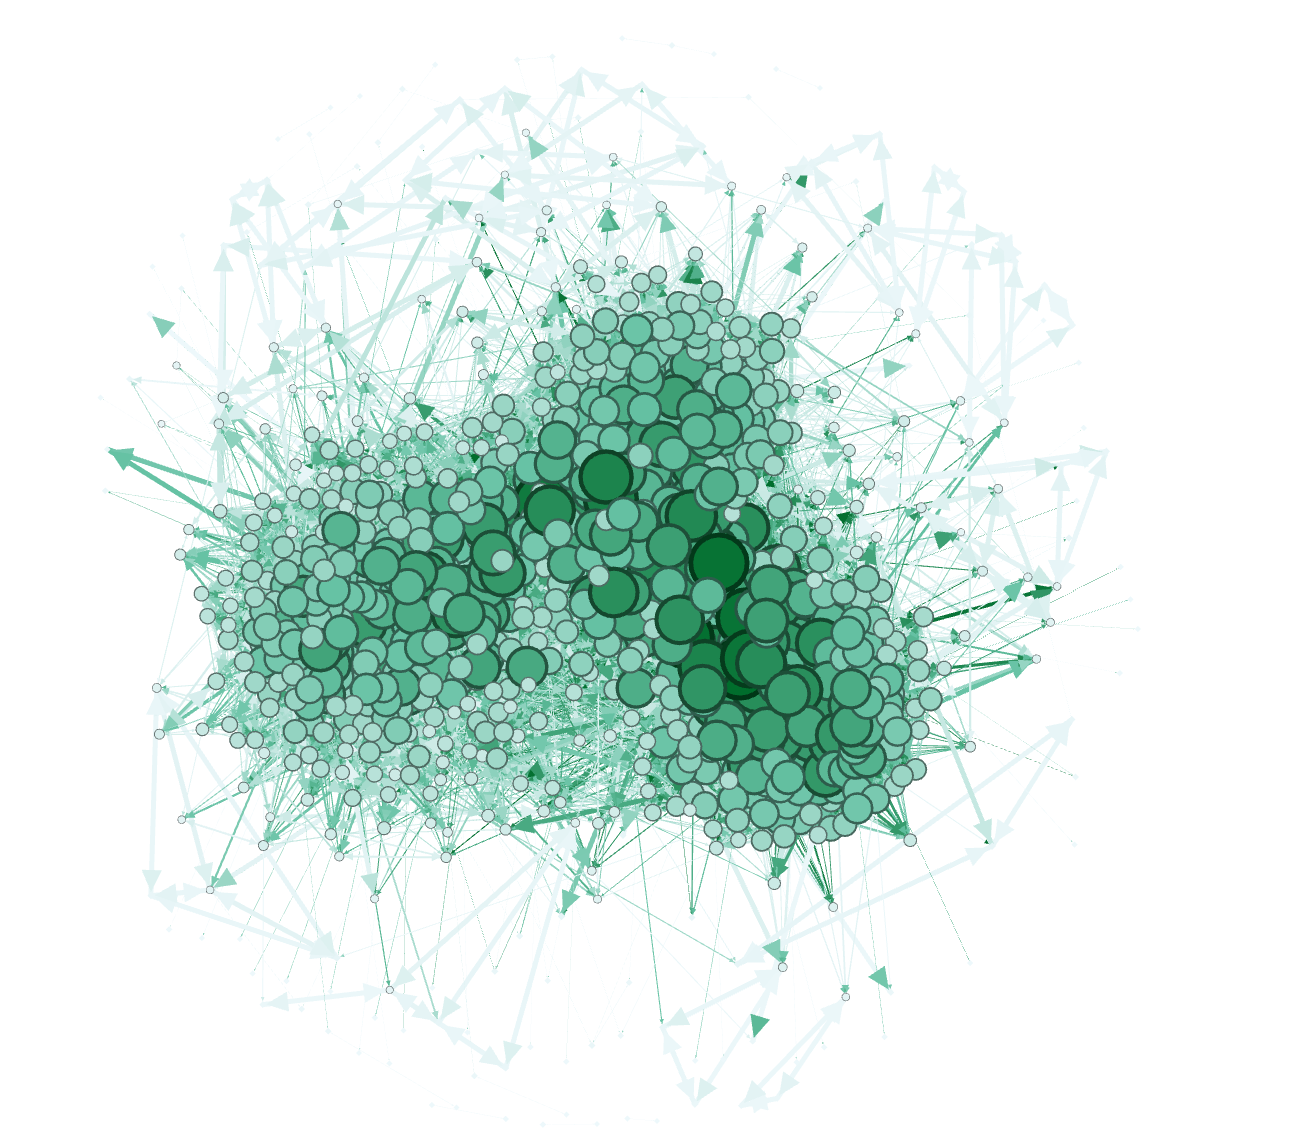
To observe the patterns of the social activities of the city, we use two different layouts with Gephi to visualize the social network of the city. The edge weight could be used to indicate the no. of interactions between 2 parties, e.g. if the 2 residents have more interactions, the edge weight will be higher.
Another possible technique is to use heatmap to show the no. of interactions for each resident across the year or total no. of interactions for all residents across the year.
We can explore more about the social communities with the social activities and participants attributes using R. For example, we can detect the communities among the social network and analyse the demographics of the clusters/groups to identify common characteristics.
We can also try identifying the dominant social influencer in the community who has the highest no. of interactions with others and the characteristics of these residents. On the other hand, the inactive residents with little social interaction could also be identified.
In addition, we can try to visualize the social network dynamics with the timestamp variable in the social network dataset and see if any significant changes happen over the period.
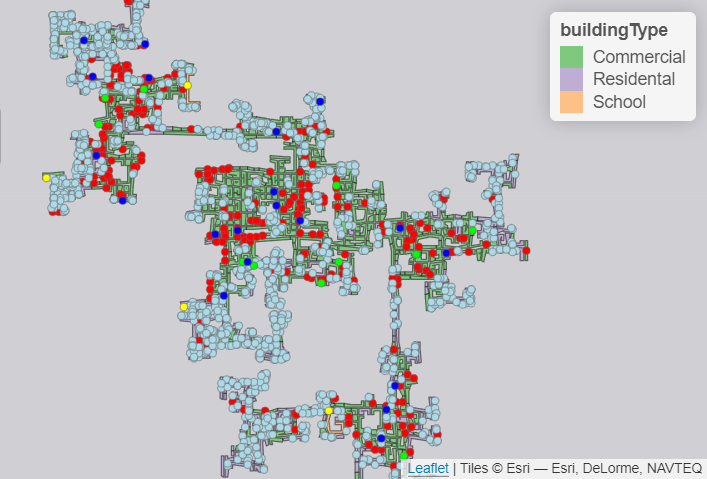
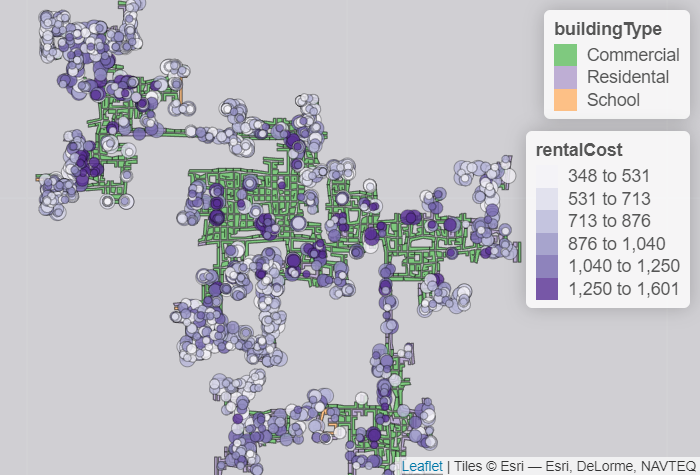
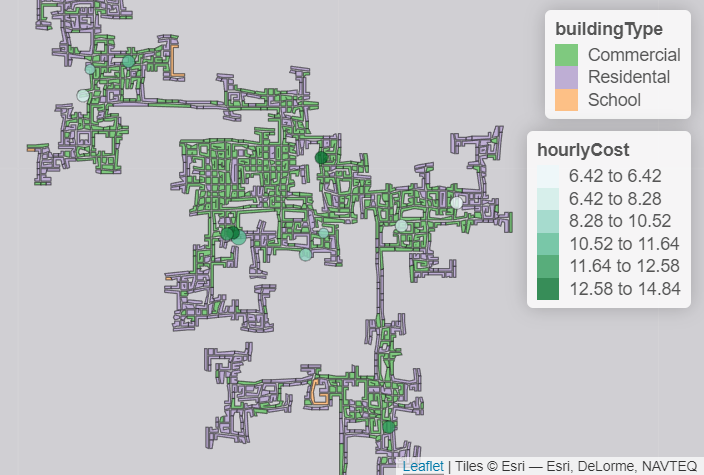
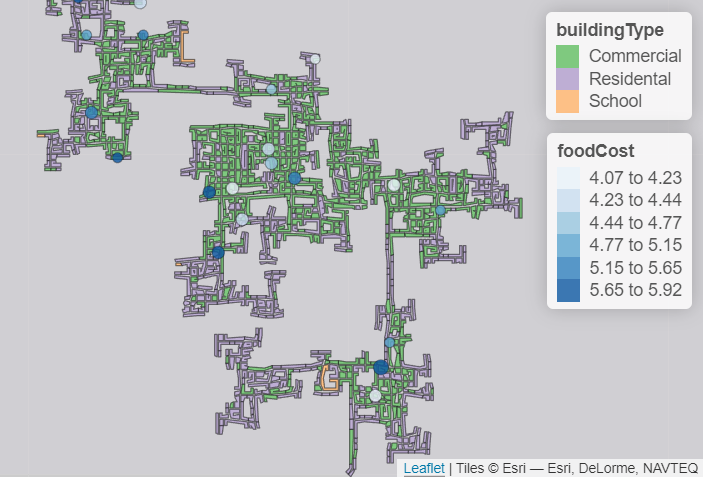
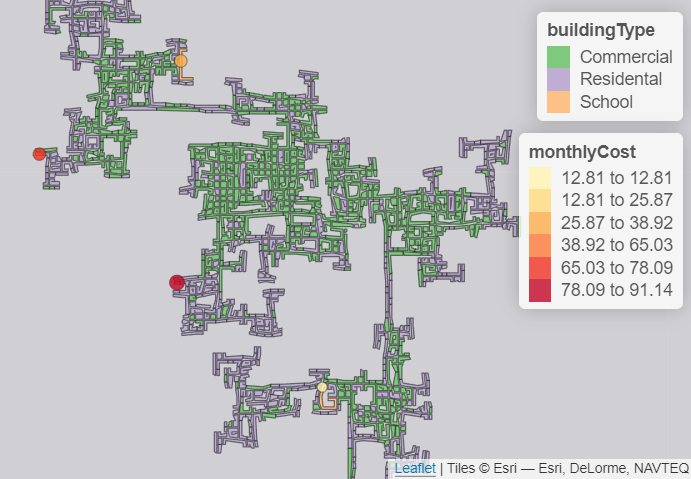
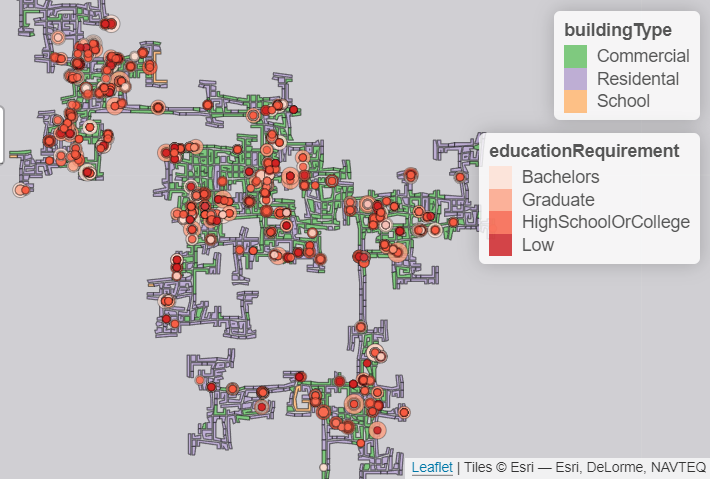
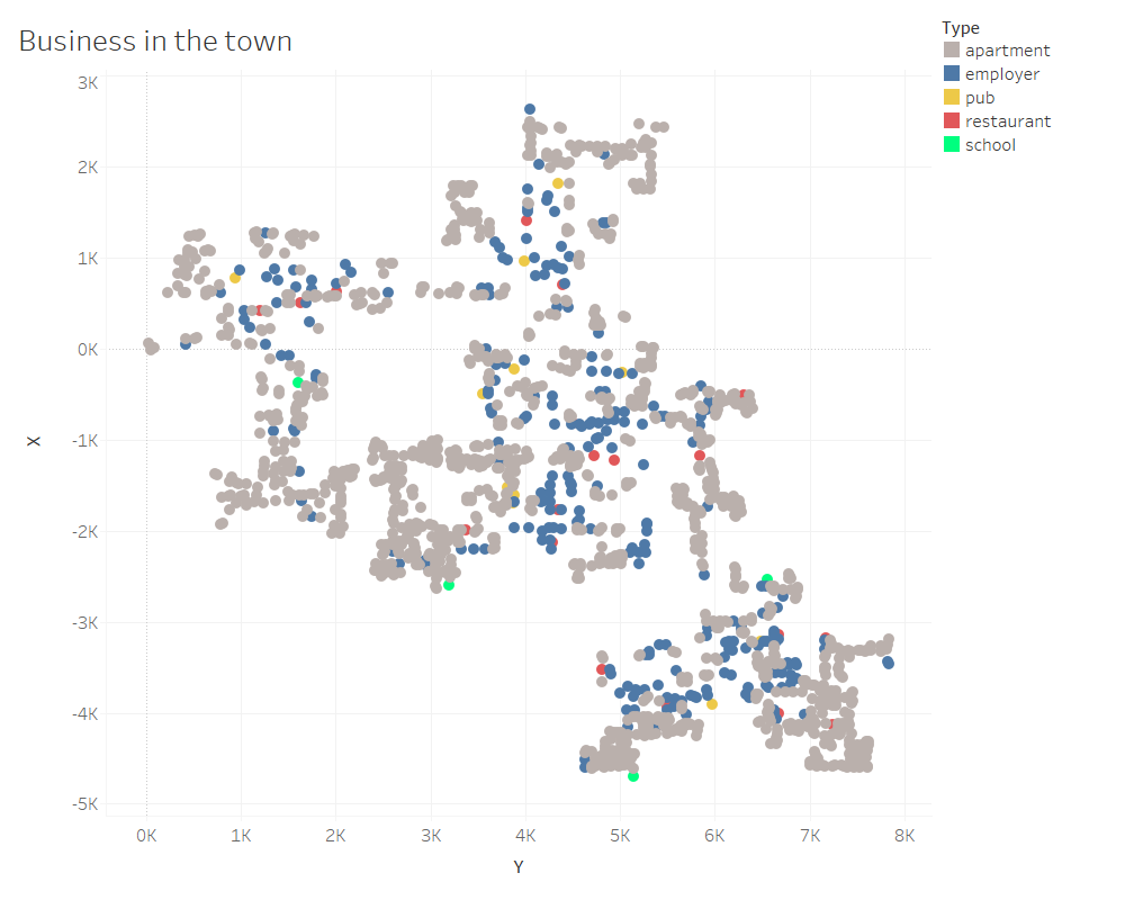
6.3 Predominant business base
For the area distribution of various types of businesses in the town, we can explore below scatter plots or generate similar map plots.
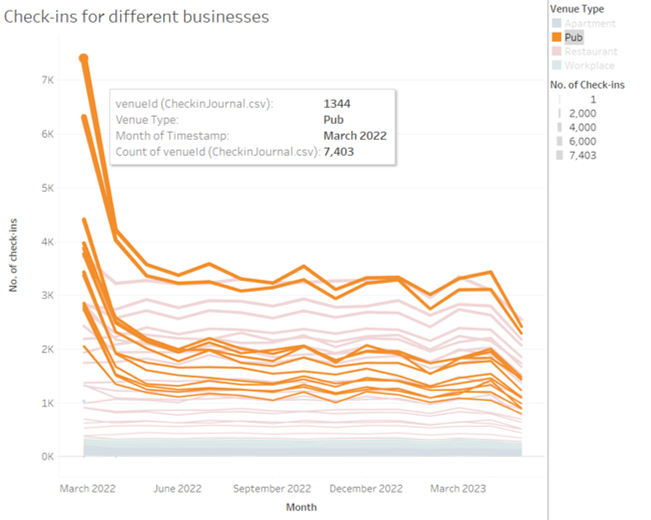
For the no. of check-ins at various locations, we can use line charts
and interactively filter based on venue type.
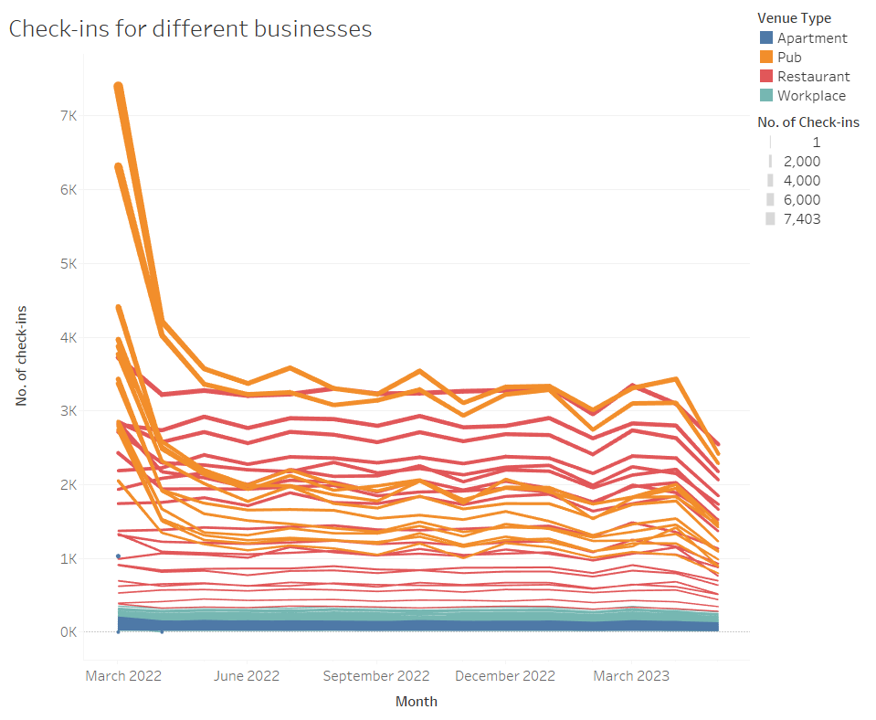 For example, we can see pub-1344
seems to have highest customer volumes among all pubs.
For example, we can see pub-1344
seems to have highest customer volumes among all pubs.
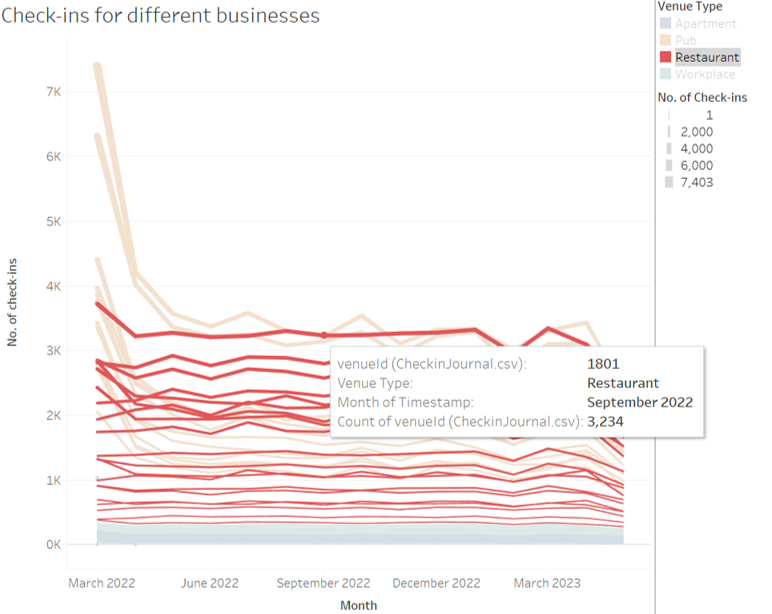
 Restarurant-1801 seems to have the
highest customer volumes throughout the year among all restaurants.
Restarurant-1801 seems to have the
highest customer volumes throughout the year among all restaurants.
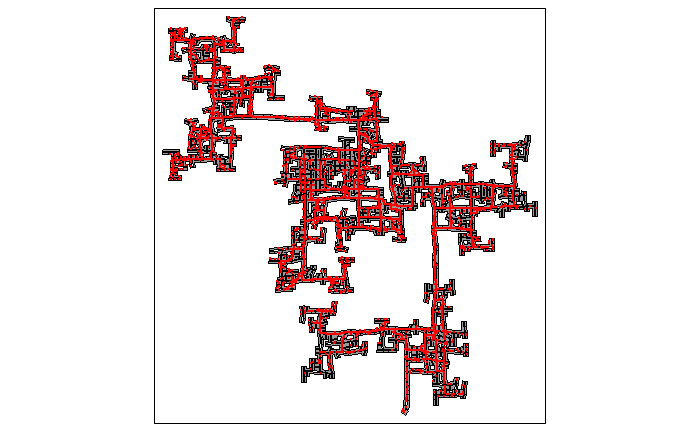
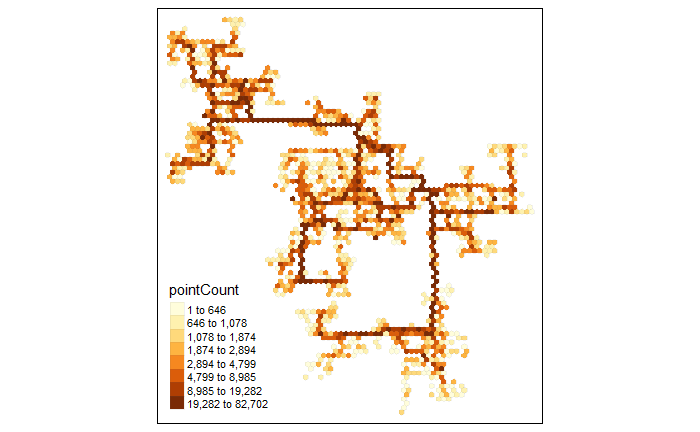
Besides check-ins, it is also possible to look at Travels data and use heatmaps to show the most popular locations. We can look at the mapping from each venue (pub, restaurant, school, employer, and apartment) to Buildings and identify which building is predominant, i.e. consists of various types of businesses or consists of more employers/pubs/restaurants than the other buildings.